Jon Hall
SOCIAL MEDIA
ADWERX
LAYOUTS
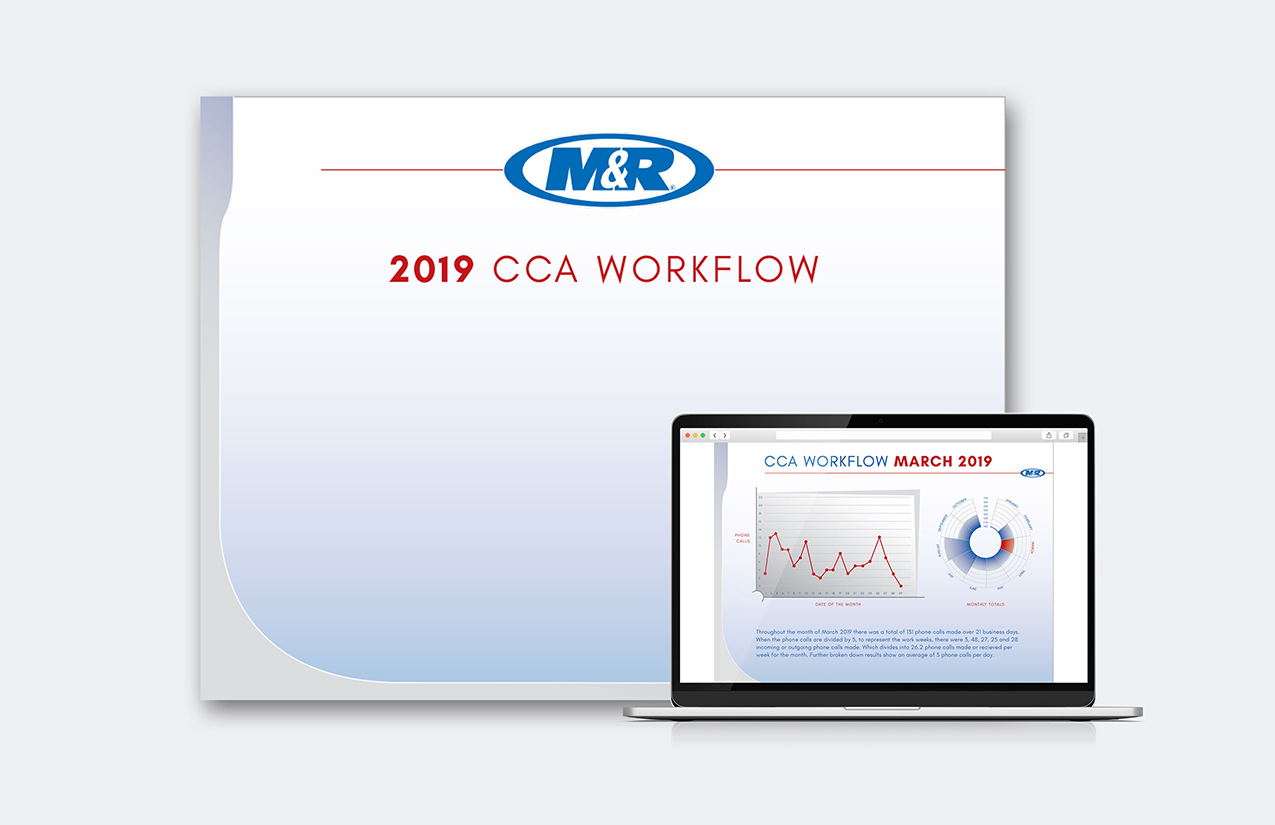
This presentation breaks down the monthly volume of phone calls made in the digital department for an individual. One graph breaks down calls for each day. The other graph represents the total monthly calls compared to the other months of the year.
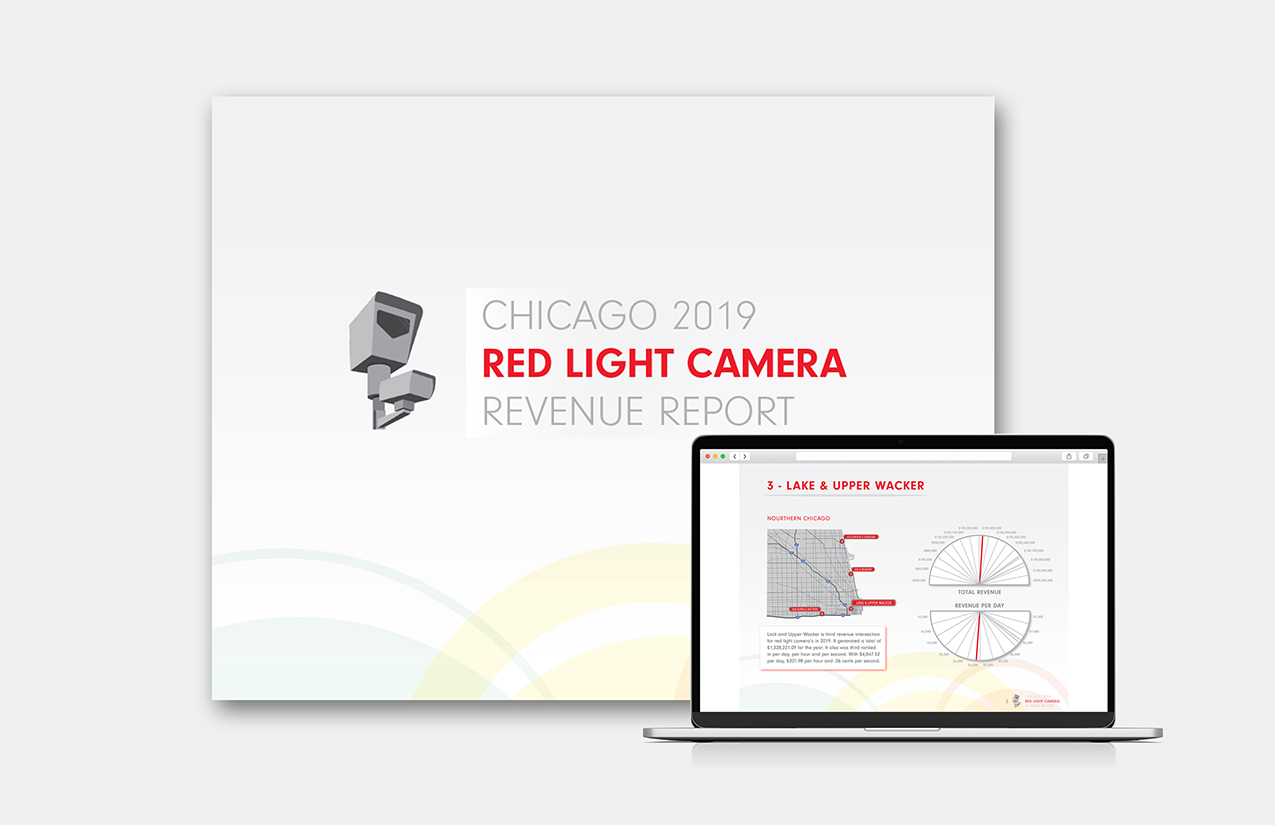
This presentation highlights the top 10 renevue red light camera's in Chicago for 2019. The infographic was inspiried by a speedometer and the circular shape of a light on a stop light. The other graphics used were also inspired by the green, yellow and red lights on a stop light.
ANIMATIONS

